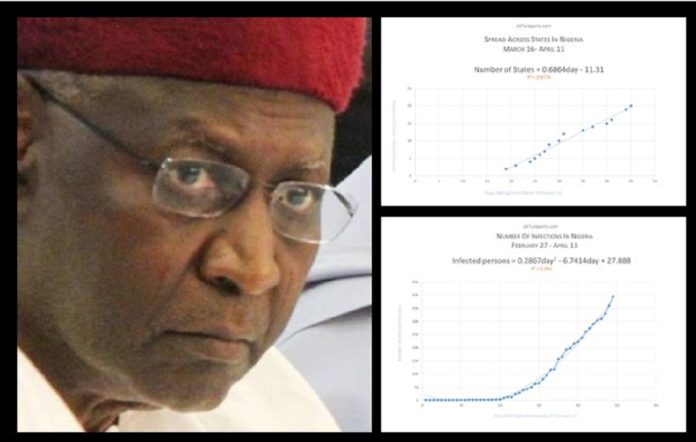
The death of the Chief of Staff to the president of the federal republic of Nigeria, Abba Kyari is expected to throw the nation into uncertainty. His death comes following his diagnosis of being positive for Corona Virus on March 27, 2020.
As a caveat, the importance of Kyari to the Buhari cannot be overstated. He was the gatekeeper to president Buhari. He was the most powerful man in Aso Villa. The president had ordered that all cabinet requests go through Kyari to him. Kyari also oversaw the movement of paper into and out of the president’s office and the president’s schedule. He attended virtually all of the president’s meetings, photo-ops, and press briefings. The president frequently used him to deliver bad news. Kyari was regularly in personal touch with virtually everybody at the top of Nigeria’s political and economic establishment. He had regular, even hourly, contact with the president, whose office was near at hand. Hence, his death has significant implications.
Through this effect, 247ureports.com carried out analysis on the data generated by National Center for Disease Control [NCDC] on the daily confirmed corona virus cases.
The analysis focused on the growth patterns in the nation, in Abuja FCT and in Lagos. The analysis also examined the spread across the states of Nigeria. The analysis was carried out to help make predictions and possible projections into the future growth rates using simple mathematical models.
The NCDC data used for the analysis is available here.
According to the NCDC, the first case of covid19 was confirmed in Nigeria on February 27, 2020 in Ogun State when an Italian man tested positive for the virus following his entrance through the international airport in Lagos State. Eleven days after, the NCDC reported another incident on March 9, 2020 in the Ogun State. The third was recorded in Lagos on March 16, 2020.
Until March 18, 2020, the positive cases were coming in droplets. After the 18th of March, the rate of spread took a turn. The infection began to increase at an alarming rate.
Particularly, between the seven days of March 18 and March 25, the rate of infection increased from 5 to 9 persons per day nationwide. And then from March 25 to April 13, the rate doubled from 10 to 20 persons per day – equaling to an increase from 8 to 330 in 26days. See Figure 1.
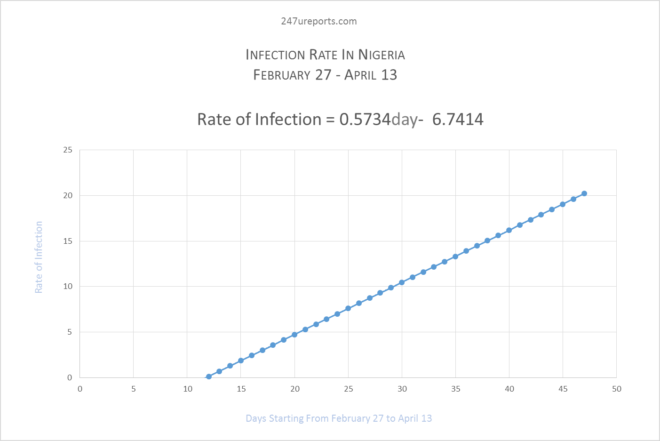
Figure-1 is a graphical representation of the growth rate of infection [ROI]. The growth rate was modeled and an equation was generated [ROI = 0.5734day – 6.7414]. The equation fits a linear progression pattern of infection for the period of days examined.
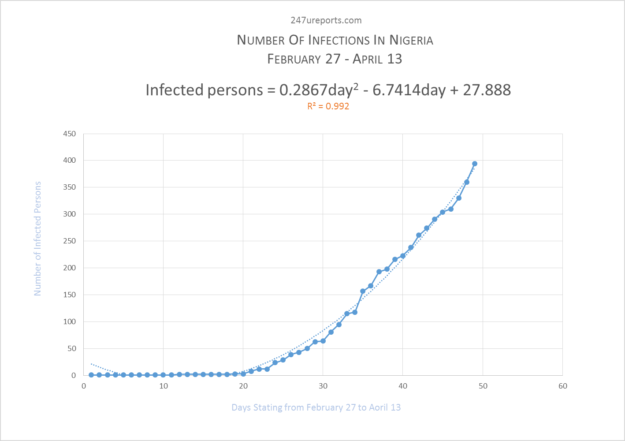
The daily infections is represented graphically in Figure 2 below. It show the daily infection [DI] between the periods of February 27 and April 13. It was modelled using simple mathematical modelling to aid the generation of an equation [DI = 0.2867day2 – 6.7414day + 27.888]. The equation indicated a polynomial pattern.
Utilizing the growth equation, future growth pattern was estimated. The number of infected persons is expected to reach and exceed 5388 within the next 100 days, if the current rate of infection continues.
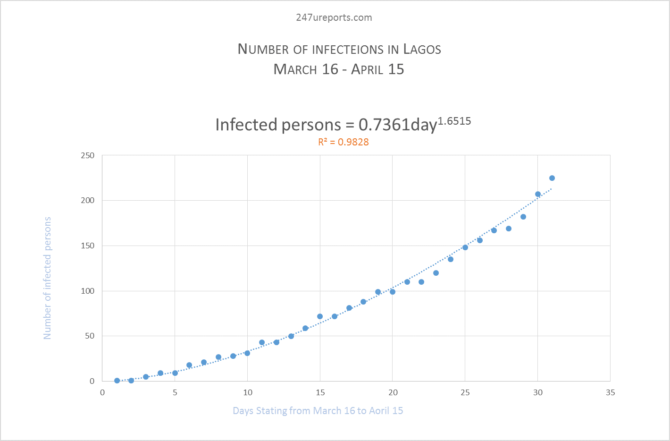
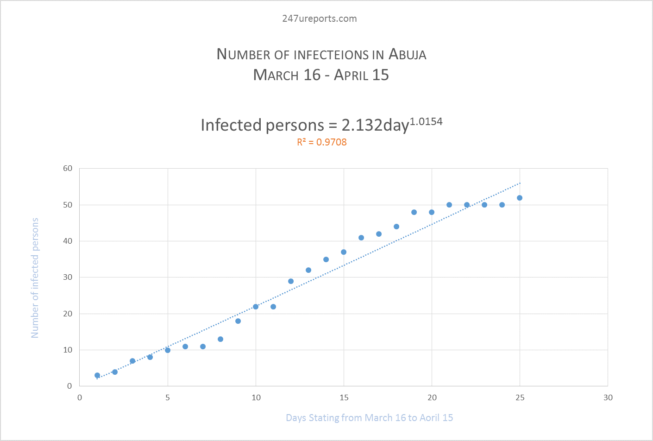
Figure 3 & Figure 4 show graphical representations Lagos and Abuja growth patterns as modeled by mathematical models. The equation for the virus spread in Lagos obtained – Number of Infected persons = 0.7361day1.6515 – depicted a growth pattern that is exponential. For Abuja, the equation obtained – Number of Infected persons = 2.132day1.0154 depicted a similar exponential growth pattern.
Going by the mathematical model, Lagos corona virus is expected to exceed 3000 while Abuja will exceed 300 cases within the next 100days if the current infection pattern continue.
Interested to note is the population densities of Lagos and Abuja correlated against the number of infected persons.
For Lagos, the population density is 2725 persons per square kilometer while Abuja is 260 persons per square kilometer. Abuja’s density is approximately 10% of that of Lagos – and the rate of infection for Abuja incidentally is approximately 10% of Lagos’ rate. This relationship points to population density as one of the main determinants to predicting the spread Nigerian cities.
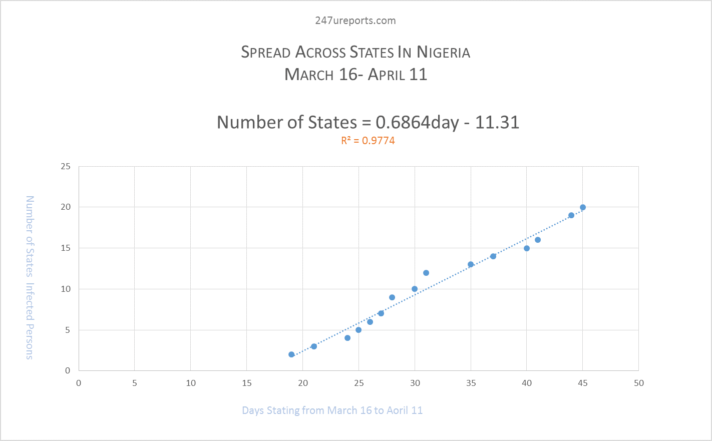
In terms of geographical spread across the States, February 27 recorded one state. By April 13, the spread had reached 20 states. According to the mathematical model, the spread shows a spread that is linear. See Figure 5 below for the graphical representation. The modeled equation [Number of States = 0.6864day – 11.31] predicts that within the next 10days, the entire 36 States will record cases of corona virus.
The Federal Government declared a lockdown on March 31, 2020 to curtail or stop the virus from spreading. However, the effectiveness of the lockdown is not easily decipherable judging by the continued growth of infections and the number of States with corona virus cases.
When the lockdown was declared, the rate of infections per day was within the range of 5 to 10. But after 14days of the lockdown, the rate of infections per day increased to 20 nationwide while the number of state registering corona virus cases continued to raise steadily.

